Last updated at Tue, 25 Apr 2023 22:10:37 GMT
This is a guest post by Ismail Guneydas. Ismail Guneydas is senior technical leader with over ten years of experience in vulnerability management, digital forensics, e-Crime investigations and teaching. Currently he is a senior vulnerability manager at Kimberly-Clark and an adjunct faculty at Texas A&M. He has M.S. in computer science and MBA degrees.
2015 is in the past, so now is as good a time as any to get some numbers together from the year that was and analyze them. For this blog post, we're going to use the numbers from the National Vulnerability Database and take a look at what trends these numbers reveal.
Why the National Vulnerability Database (NVD)? To paraphrase Wikipedia for a moment, it's a repository of vulnerability management data, assembled by the U.S. Government, represented using the Security Content Automation Protocol (SCAP). Most relevant to our exercise here, the NVD includes databases of security-related software flaws, misconfigurations, product names, impact metrics—amongst other data fields.
By pouring through the NVD data from the last 5 years, we're looking to answer following questions:
- What are the vulnerability trends of the last 5 years, and do vulnerability numbers indicate anything specific?
- What are the severities of vulnerabilities? Do we have more critical vulnerabilities or less?
- What vendors create most vulnerable products?
- What products are most vulnerable?
- Which OS? Windows OSX, a Linux distro?
- Which mobile OS? IOS, Android, Windows?
- Which web browser? Safari, Internet Explorer, Firefox?
Vulnerabilities Per Year
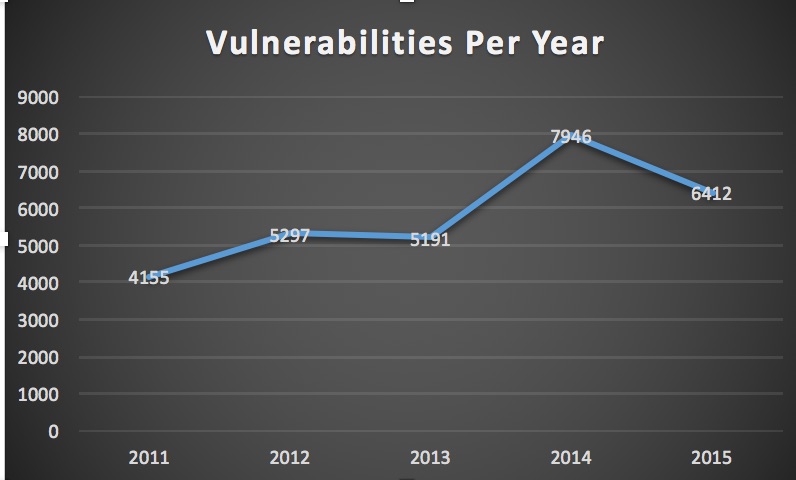
That is correct! Believe it or not, there was a 20% drop in the number of vulnerabilities compared to the number of vulnerabilities in 2014. However, if you look at the overall trending growth in the last 5 years, the 2015 number seems to be consistent with the overall growth rate. The abnormality here was the 53% increase in 2014. If we compare 2015's numbers with 2013, then we see 24% increase.
All in all though, this doesn't mean we didn't have an especially bad year as we did in 2014 (the trend shows us we will have more vulnerabilities in the next few years as well). That's because when we look closely at the critical vulnerabilities, we see something interesting. There were more critical vulnerabilities in 2015 then 2014. In 2014 we had more vulnerabilities with CVSS 4, 5, and 6; however, 2015 had more vulnerabilities with CVSS 7, 8, 9 and 10!
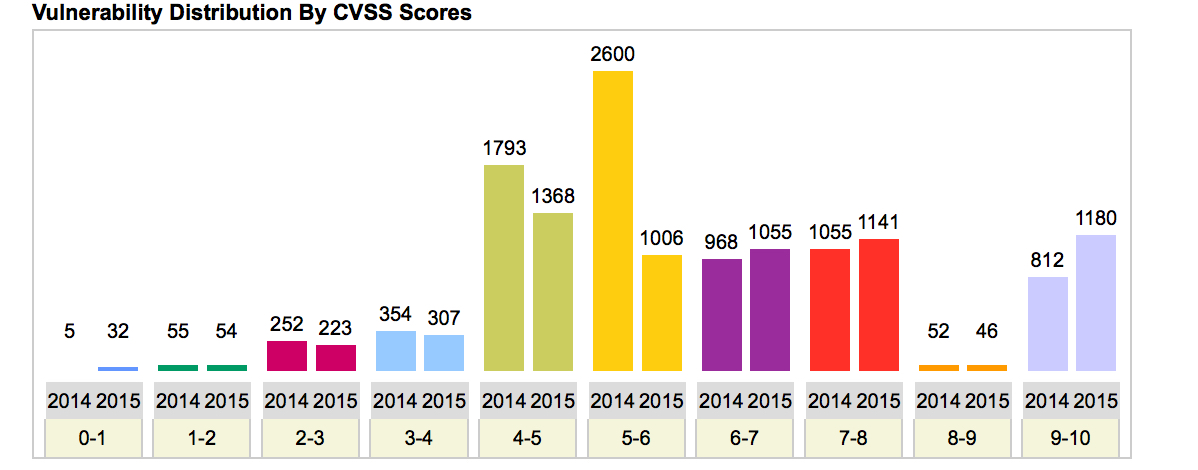
As you see above there are 3376 critical vulnerabilities in 2015 where as there were only 2887 critical vulnerabilities in 2014. (That is a 17% increase.)
In other words, the proportion of critical vulnerabilities is increasing overall. That means we need to pay close attention to our vulnerability management programs and make sure they are effective—fewer false positives and negatives—up-to-date with recent vulnerabilities, and faster with shorter scan times.
Severity of Vulnerabilities
This chart shows weight distribution of 2015 vulnerabilities, based on CVSS score. As (hopefully) most of you know, 10 is the highest/most critical level, whereas 1 is the least critical level.
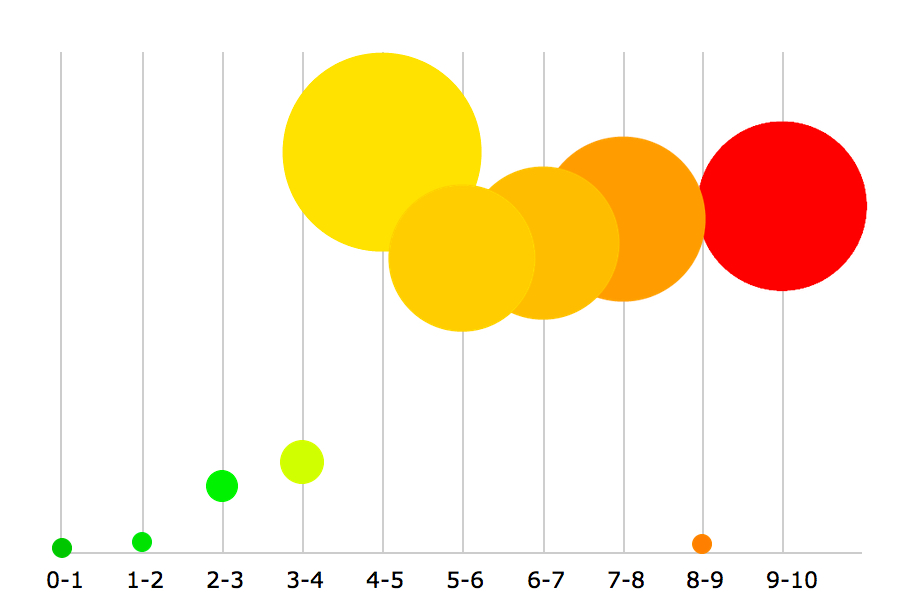
There are many vulnerabilities with CVSS 9 and 10. Let's check following graph that gives more clear picture:
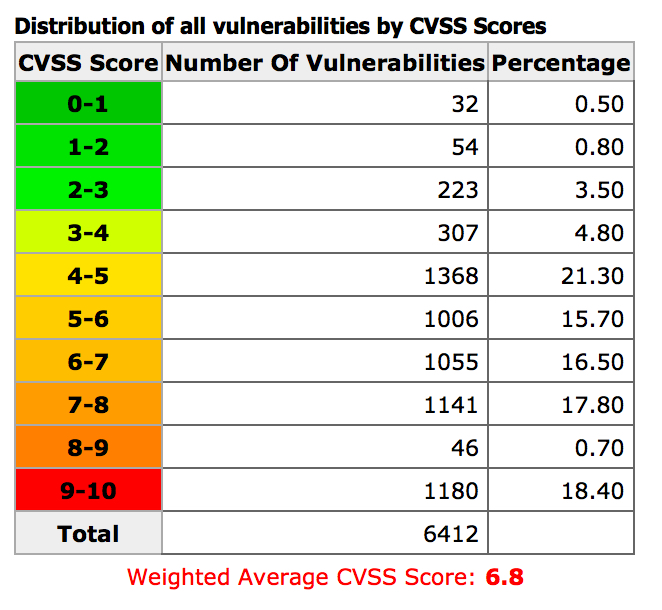
This means 36% of the vulnerabilities were critical (CVSS >=7). The average CVSS is 6.8 so that is at the boundary to be critical.
The severity of vulns is increasing, but this isn't to say it's all bad. In fact, it really exposes a crucial point: That you have to be deploying a vulnerability management program that separates the weak from the chaff. Effective vulnerability management program will help you to find and then remediate vulnerabilities in your environment.
Vulnerability Numbers Per Vendor
Let's analyze national vulnerability database numbers by checking vendors' vulnerabilities. The shifting tides in vulnerabilities doesn't stop for any company, including Apple. The fact is there are always vulnerabilities, the key has to be detecting these before they are exploited.
Apple had the most number of vulnerabilities in 2015. Of course with many iOS and OSX vulnerabilities out there in general, it's no surprise this number went up.
Here is the full list:
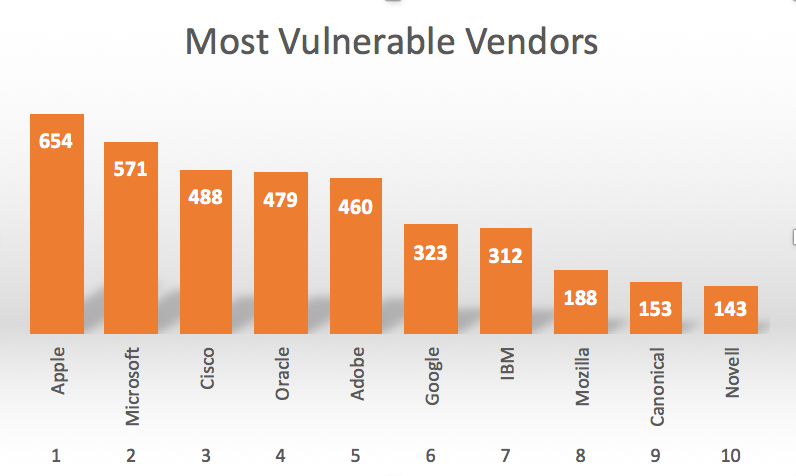
Apple jumped from being number 5th in 2014. Microsoft was number 3rd and Cisco was number 4th. Surprisingly Oracle (owner of Java) did well this year and took 4th place (they were number 2 last year). Congratulations (?) to Canonical and Novel, as they were not in top 10 list last year (they were 13rd and 15th). So in terms of prioritization, with Apple making a big jump last year, if you have a lot of iOS in your environment, it's definitely time to make sure you've prioritized those assets accordingly.
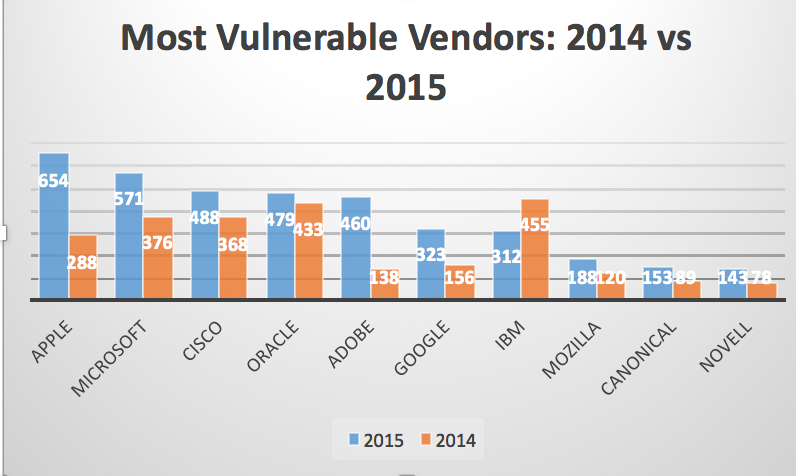
Here's a comparison chart that shows number of vulnerabilities per vendor for 2014 and 2015.
Vulnerabilities Per OS
In 2015, according to the NVD, OSX had the most vulnerabilities, followed by Windows 2012 and Ubuntu Linux.
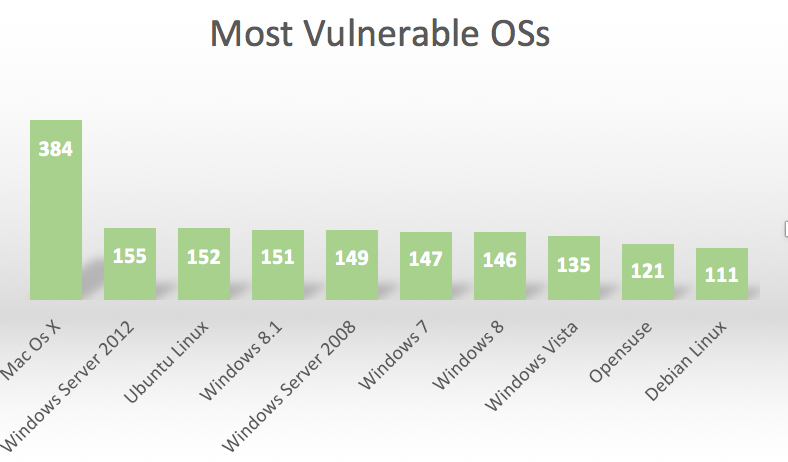
Here most vulnerable Linux distro is Ubuntu. Opensuse is the runner up and then Debian Linux. Interestingly Windows 7, the most popular desktop application based on its usage, is reported to be less vulnerable then Ubuntu. (That may surprise a few people!)
Vulnerabilities Per Mobile OS
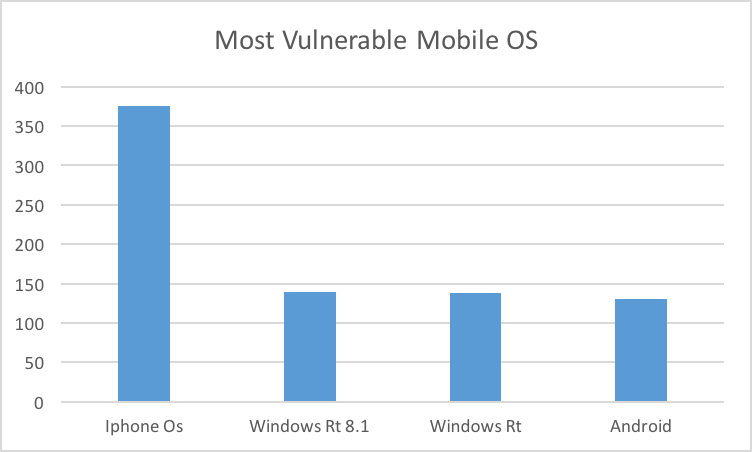
IPhone OS has the highest number of vulnerabilities published in 2015. Windows and Android came after iPhone. 2014 was no different. iPhone OS had the highest number of vulnerabilities and Windows Rt and Android followed it.
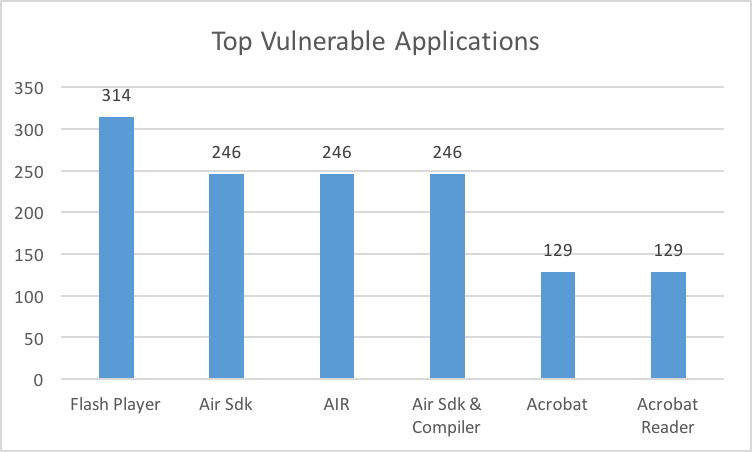
Vulnerabilities Per Application
Vulnerabilities Per Browser
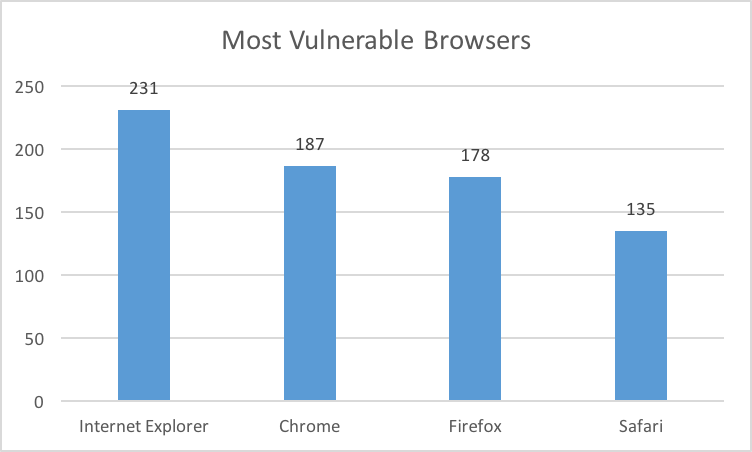
IE had highest number of vulnerabilities in 2015. In 2014, the order of product with the highest number of vulnerabilities were exactly same. (IE, Chrome, Firefox, Safari.)
Summary
Given the trends over the past few years reported via the NVD, we should expect more vulnerabilities to be published with higher CVSS score this year. Moreover, I predict that mobile OS will be hot area for security — as more mobile security professionals find and report mobile OS vulnerabilities, we'll see an increase in Mobile OS vulnerabilities as well.
It's all about priorities. We only have so many hours in the day and resources available to us to remediate what we can. But if you take intel from something like the NVD and layer that over the visibility you have into your own environment, you can use this information to help build a good to-do list built by priorities, and not fear.
