Last updated at Tue, 25 Jul 2017 16:11:47 GMT
Hi SecurityStreet, let me introduce myself. I've been an Enterprise Security Engineer at Rapid7 for almost two years now, and have seen fads come and go. Think 0-day Flash updates (ok – maybe not; to Adobe's credit – they've significantly decreased their bugs as time goes on), but one theme has been consistent – how the @#$% do I go about analyzing risk?
Analyzing risk is one of the most difficult aspects of any good risk assessment program: risk can be broken down by device, asset classification (i.e., PCI compliance), business unit, etc.; however, the underlying issue still remains. Where's the nugget of information, and how can I communicate it to the teams involved (i.e., IT, patch management) so that the company is secure, business continuity isn't affected and I can get a bonus for all my hard work?
Yes, we will be using Excel to solve one problem (ekk… not again), and PHP to solve anther. Look on the bright side: the work is already done for you; all you need to do is generate the data and run the script.
Report 1: I'm applying patches; but I'm still seeing these vulnerabilities. The @!#$@*$ tool doesn't work.
WHO: It depends on the size of the company. For the SMB customers we've dealt with, it's usually the security team because they're time-splicing between applying patches, looking at vulnerabilities, and of course dealing with my favorite: “I forgot my password, can you reset it for me?”.
WHAT: The patch management team has pushed out the patches, but the vulnerability count for the vendor/product appears consistently high.
WHY: Perhaps there's a firewall rule that's applied preventing certain updates from successfully applying, or the patch wasn't created correctly, that the patch didn't clean up older version (older Adobe versions were notorious for this one), or, or, or…
How do you solve the problem?
- Create a CSV export from Nexpose with the following columns:
- Vulnerability ID, Vulnerability Test Date, Vulnerability Test Result Code, Vulnerability Tags
- Create a pivot graph with the following element (I'm using Excel 2010 here):
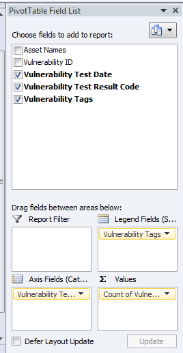
- Generate graph!
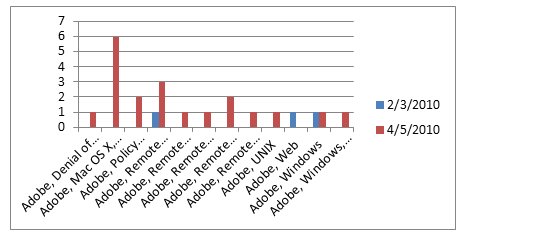
What's the story here? It seems that from 2/3/2009 to 4/5/2010 the total number of Adobe vulnerabilities increased. Analyzing the problem further (i.e.: look at the proof section) will perhaps show you that even though the patches might've been applied, flash wasn't updated and that's the culprit.
So – by looking at this information – you can quickly glean that perhaps the patch management process needs to be updated!
Problem 2: Teach a man to visualize risk… they'll (hopefully) understand why a risk management program is important.
WHO: Any visual learner with their hands in IT!
WHAT: Teaching the concept of risk to visual learners.
WHY: How do you teach non-security-aware members (who, say, are visual learners) in the company about risk? If they don't understand the problem how will they know what you're talking about? How do you solve the problem? Visualize the problem so you can involve others in the decision making process.
- Create a CSV report with the following elements:
- Vulnerability Test Date, Vulnerability Tags, Asset OS Family, Asset IP Address
- Install PHP
- Download the following files and execute:
- php flare.php >./sunburst/flare.js
- From your browser – open sunburst.html
- And check out your handy work!
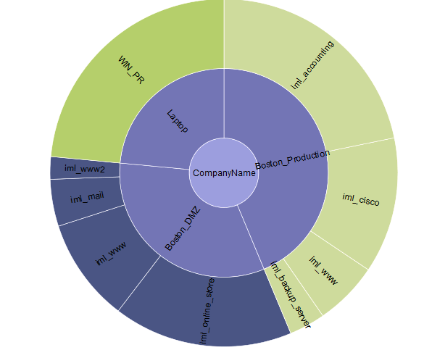
The graph above visually depicts risks based on risk score. So just by a quick glance, one could surmise that the highest risk asset is iml_accounting within the Boston_Production site since it takes the highest chunk of the pie. By visualizing information you can now communicate to a larger audience, in this case visual learners. By helping them visualize the concept of risk in terms that they can see, you've achieved multiple goals:
- Got them thinking in terms of risk
- Hopefully provided more ammunition to ask for additional resources since they manage more assets than their counterparts (always a great way to make friends)
- This pie concept can be further extended to show the risks per vuln per asset too… post a comment if you'd like to see this!
- Now – when they think about pies – hopefully, they'll give you some!
