Last updated at Wed, 30 Aug 2017 00:14:32 GMT
We are pleased to announce the next version of Nexpose, version 5.7. This release focuses on helping to provide context on how well your Security Program is performing and helping you simplify your vulnerability management processes to help you save time.
The last release of Nexpose, Nexpose 5.6, introduced the new Top Remediation report to the product. The Top Remediation Report enables Nexpose users to bridge the gap be-tween translating known vulnerabilities that have been discovered on their network into targeted remediation steps for their remediation teams. The report enables organizations to focus not just on remediating the severe vulnerabilities on their network in top down order, but to also gain an understanding of the remediation steps that would provide the most "bang for your buck" in their environment, allowing them to prioritize work efforts more effectively. Since security teams often struggle with resourcing, the top remediation report helps teams focus on the issues that are of the utmost importance at any given time.
But....How well am I doing?
Having knowledge of the targeted remediation steps to perform, in what order, enables security teams to make smart decisions on what to remediate. However, even though this functionality provides great value to an organization, they still struggle to answer that question of "How do I know how well I am doing overall?" Auditors, CISO's and Security managers put a lot of pressure on security teams to prove that the tools in their arsenal provide value. Traditional security software is great at helping users answer the tactical question of "What are my biggest risks right now?", but really struggle in enabling security teams to prove that they have made smart decisions on what to work on in the past.
Information Security is a highly dynamic field that requires a constant shifting of priorities to deal with new threats in the environment. It is a fine balance for security teams. The most important threat to remediate yesterday may no longer be the most important threat for security personnel today. It is so easy for security teams to get lost jumping around from shifting escalation to escalation, such that is becomes more and more difficult for them to get a handle on whether or not they were really doing the right things, or just being reactive to whoever yells the loudest every day. In addition, it is becoming harder and harder for security teams to manage incoming threats. Every year brings an increase in the number of reported vulnerabilities known to exist, and this in turn, brings an expansion in the tools available in an attackers arsenal. As the number of threats to continues to compound in size year over year, how does a security administrator prove to anyone that they truly are focusing on the right things?
The new version of Nexpose 5.7 helps security teams solve this problem by including a new trending report directly within the product. Using trends to determine how well you are doing in any process is nothing new. So, what makes this different?
As mentioned previously, the number of known vulnerabilities in all products grows year over year, The number of vulnerabilities discovered this year will be greater than the last. Tracking the total number of vulnerabilities/risks in your environment may not be the best way to measure overall success. If everything stays constant from a personnel and security process standpoint year over year, it is expected that the total number of vulnerabilities affecting your environment will go up as time goes on, even if you have a mature remediation process. Since new vulnerabilities are discovered all the time, throughout all 365 days a year, who knows when there will a be a spike in vulnerabilities that may affect you? Obviously, your superiors will not be happy if they are just shown a graph that states that the number of vulnerabilities have gone up without any additional context.
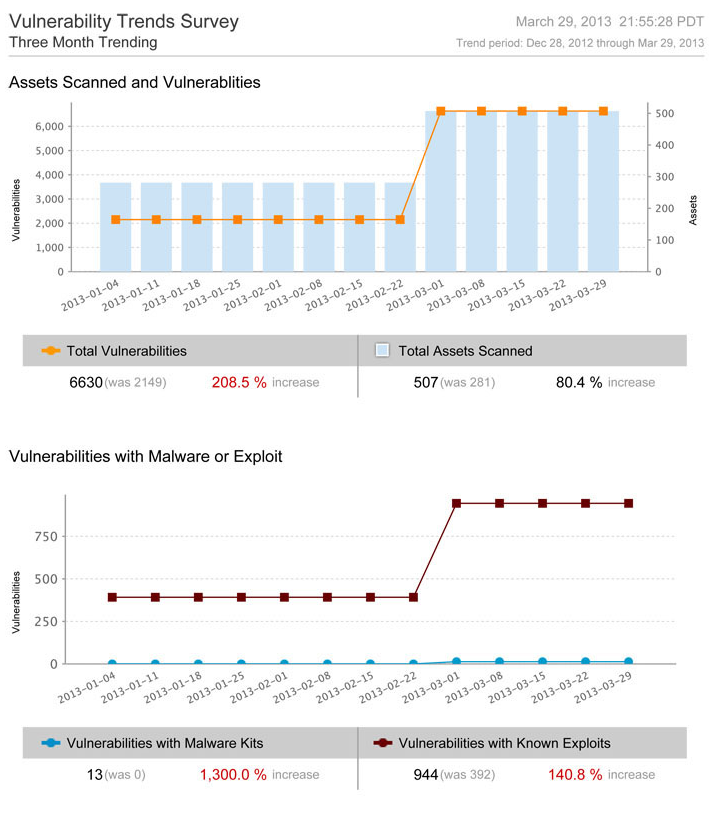
As you can see from the above screenshot, this is a trending report over a four month period. The top graph highlights the change in the number of vulnerabilities discovered over the requested timeline. Obviously, as shown in the example, the number of vulnerabilities went up considerably by 208.5%. This can be problematic if you want to prove that you are doing well. However, in the same graph, you can also see that the total number of assets scanned went up by ~80%. This helps to provide some colour as to why the number of vulnerabilities went up over this time frame. The overall scope of what was being scanned increased.
In addition, the bottom graph highlights the number of vulnerabilities within your network that are associated with known Malware Kits or Known Exploits. It is inherently important to always focus on the vulnerabilities that are known to be exploitable in your environment, as attackers tend to always focus on the issues that are easy to exploit. This provides you with another lens into your overall security profile. You can easily highlight that your organization has spent their time focusing on remediation efforts that target vulnerabilities that are the highest risk to your environment. This helps you prove that you were targeting the most important vulnerabilities to remediate over the time of the trend.
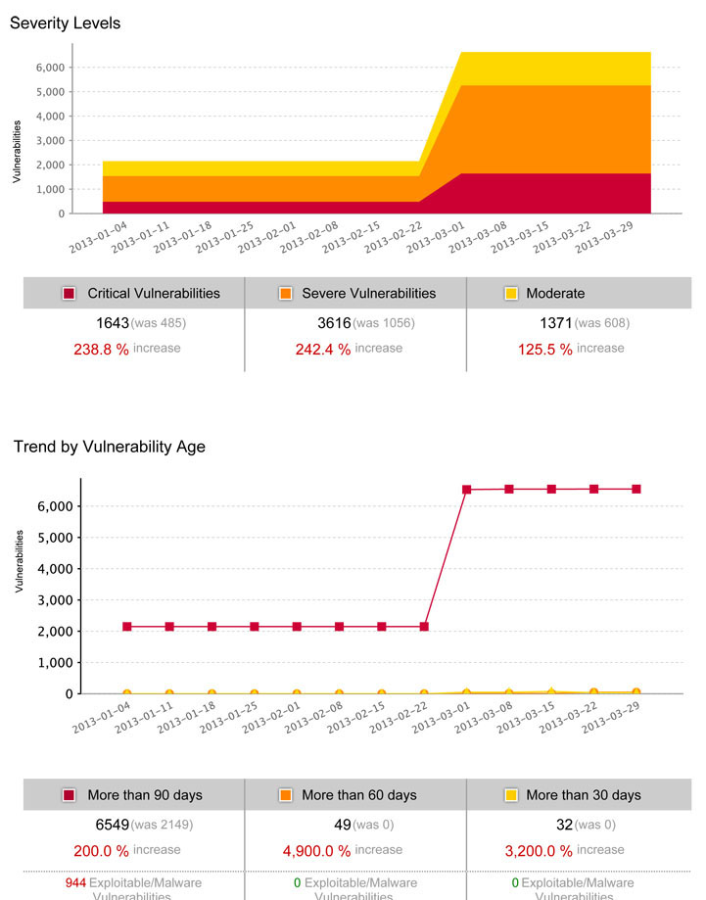
The second page of the report, shown above, helps provide alternative views into the success of your security program. The severity, similar to the exploits/malware view, helps provide context into whether or not your organization is focusing on the right vulnerabilities to remediate. It is logical to focus on the vulnerabilities that are the most severe first, before starting to tackle the other less severe vulnerabilities. This view allows you to highlight to various stakeholders that you are focusing your effort of the vulnerabilities that are the most critical to the environment, allowing the stakeholders to see that there is a targeted multi-step plan in place to move your security program forward.
Lastly, the report includes a time based view. The final view of the report allows you to see the vulnerabilities in your environment based on the overall age of the vulnerability. This enables you to see the age of the vulnerabilities within your network and how long it is approximately takes for your team to remediate vulnerabilities. Is the team always falling behind on new threats or is the team handling the incoming flow at a reasonable rate?
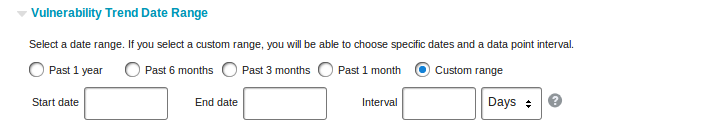 In addition, you are able to also choose the time range that you would like to trend on. It is understood that each organization measures their overall success differently over different time slices. Hence, you have the ability to customize the time frame that you want to look at to build
Combining the new trending report with the present filtering functionality in Nexpose provides even more value to your security program.
- The ability to restrict the vulnerability severity and vulnerability categories, of which Nexpose has 145 of them, to include within a report allows you to track a subset of the vulnerabilities within the product over time. For example, you could include the vulnerability category called 'Adobe Flash' as part of the scope of the report. This allows you to generate a report with only Adobe Flash vulnerabilities within it and see how well your organization is doing across just the groups of vulnerabilities that you are interested in. This allows you to not only look at the trend across your entire organization, but to also look break down how well the various remediation teams are doing throughout your organization
- Also, the ability to restrict the generation of a report to a particular site and asset group also is very beneficial. As an example, let's assume that your organization breaks down your assets into sites based on location. Therefore, you can generate the trending report for each of the various sites and measure each of the locations against each other. This allows you to further break down the overall organization trend into various buckets and see how well your teams are doing individually across the world.
The trending report, coupled with the current ability to filter data within reports, is a very powerful tool that allows you to easily gain an understanding of how well your vulnerability program is doing overall. It also provides you with the information required to help highlight the overall success to the various stakeholders in your organization.
Performing Repeatable Tasks Faster
Nexpose 5.7 also includes new functionality to simplify the overall workflow around certain tasks that are often repeatable.
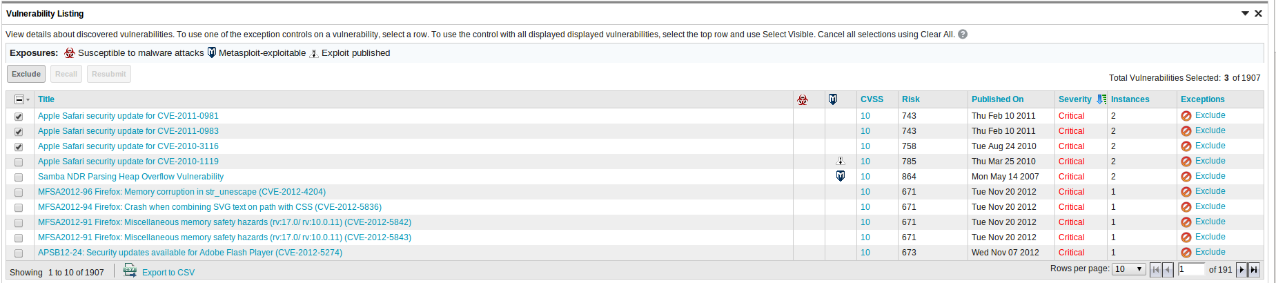
The first workflow improvement is around vulnerability exceptions. Nexpose 5.7 builds on top of our flexible exception management functionality and makes it easy by including the ability to bulk exclude multiple exceptions at once in the asset view. Therefore, Nexpose now gives you the ability to bulk exclude vulnerabilities for the same reason across multiple scopes.
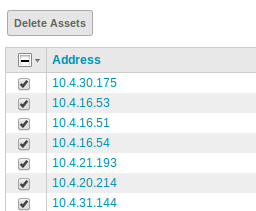
The second improvement to the overall workflow is an easier way to delete multiple assets at once. Users can now use the selection workflow to delete assets from Nexpose that they no longer want to see. Coupling the ability to delete multiple assets with the ability to create a Dynamic Asset Group based on last scan date, users can now easily delete assets from Nexpose that have not been seen within a set time frame in one place to purge old assets.
These enhancements are designed to continue to simplify vulnerability management for our users. We want to not only help you make an informed decision on what to do next, but to also prove that you are making the right decisions in vulnerability management for your organization. We know that it can often be difficult, when inundated with new risks and threats, to help balance spending time focusing on the new thing versus the right thing to do. We know that building a mature security program takes time and it is not getting any easier. The features in this release assist in helping you showcase to your management that you are making the right decisions and are bringing your security program forward.
For more information on Nexpose 5.7, you can look at the release notes here.
